
CEOInterviews.AI
Start App
Try: AI strategy tariffs earnings guidance layoffs interest rates growth

Matt Sundquist

Cofounder, Plotly

Search every verified Matt Sundquist interview, podcast appearance, and on-the-record quote — each transcript cross-checked by AI and human review to confirm speaker identity. In a 2015 PyData Seattle talk, Matthew Sundquist, cofounder of Plotly, described the company's Python API for creating plots directly from Python and pandas, including maps, 3D plots, and other visualizations. He explained that Plotly is based in Montreal and aims to support collaborative, cloud-based plotting, with all APIs and figure converters being open source. Sundquist noted that users can do unlimited free public plotting on the cloud, with edu accounts available for educational projects, and that licensing is offered for offline or on-premises server use. Sundquist stated that Plotly uses D3 and WebGL for browser-based rendering, and that data is sent to Plotly's servers when using the cloud product, then rendered on the client. He emphasized that Plotly does not make intellectual property claims to user data. He also mentioned that users can comfortably plot 20,000 to 40,000 points per plot in the browser, with the offline product supporting millions of points, and that a new WebGL backend was in development to allow for even larger datasets.

Recent appearances

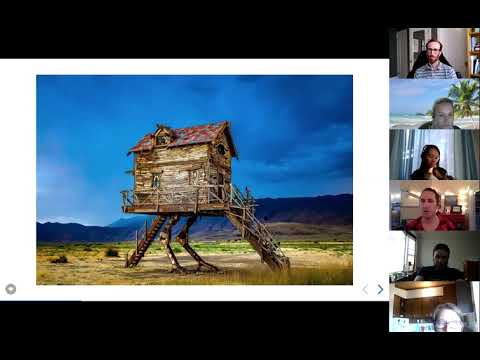
  • Data Science for Sustainability: Burning Man's Fly Ranch (Sept 23, 2020)

    Every August, the annual Burning Man event transforms a desolate corner of northern Nevada into a thriving temporary metropolis fueled by creativity, experimentation. In 2016, the organization behind this city acquired Fly Ranch, a 3,800 acre property just north of the event site. This property is home to dozens of hot and cold springs, three geysers, acres of wetlands, dozens of animal species, and more than 100 identified types of plants. The Fly Ranch project is an opportunity to create a year-round rural incubator for Burning Man culture and a catalyst for innovation and creativity in the…

    Watch on YouTube ↗

  • PLOTCON 2016: Matt Sundquist and Ben Jones, Tableau & Plotly for Collaboration

    Companies and teams use a blend of data analysis tools. This can make it hard to collaborate, build good workflows, or effectively analyze data. This talk takes account of this complexity, showing how to use Tableau and Plotly together. We'll demonstrate how you can fetch and share data between Plotly or Tableau dashboards and data grids. We'll show how to use Plotly's APIs and data extractor then embed graphs in Tableau dashboards. We'll also combine dashboards using Plotly and Tableau. We'll include a theory of how to practically introduce collaborative solutions to your team. Matt is…

    Watch on YouTube ↗

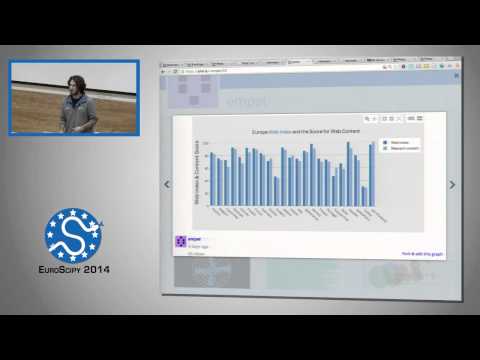
  • Plotly Collaborative Python and Matplotlib Plotting | EuroSciPy 2014 | Matthew Sundquist

    Uh hi everyone my name is Matt um I'm working on this project plotly and uh we are um graphing an analytics platform so our ...

    Watch on YouTube ↗

  • Matthew Sundquist: The Possibilities Of Plotting With pandas and IPython

    PyData Seattle 2015 A wave of complimentary new tools allow developers to quickly access, analyze, and plot data. IPython Notebooks let you harness these libraries and code in a web-based, language agnostic Notebook. Pandas lets you wrangle your data. And matplotlib, ggplot for Python, Plotly, bokeh, and Seaborn let you make beautiful, interactive plots. This talk shows how to use and deploy these tools together. A new wave of Python libraries enable interactive, scientific figures, and web shareability. From Python we can access and manipulate data with pandas, make 2D, 3D, and live-streamin…

    Watch on YouTube ↗

  • Data Viz with Matt Sundquist

    The San Diego Python User Group along with the Data Science and R User Group co-hosted a meetup with presentation by Matt Sundquist from plotly. Plotly: http://plot.ly San Diego Python User Group: http://www.meetup.com/pythonsd San Diego Data Science-R Users Group: http://www.meetup.com/San-Diego-Data-... Event pages for this particular meetup: http://www.meetup.com/pythonsd/events... http://www.meetup.com/San-Diego-Data-... video note: There's a 20 minute limit on recording video with the camera used (Nikon D750), so this video is stitched together from a couple recordings. If you notice a…

    Watch on YouTube ↗

  • Matt Sundquist and Plotly

    Matt Sundquist will present on Plotly: Collaborative Python and IPython plotting.

    Watch on YouTube ↗

  • Plotly - Matt Sundquist Startup Demo at SVNewTech

    Uh hi everyone my name is Matt I uh I'm a co-founder at plotly um we're an online graphing and analytics platform uh and our goal ...

    Watch on YouTube ↗

  • Sundquist & Sarafa - On Harvard Time Special Edition

    Get a closer look into the Harvard Undergraduate Council 2007 Presidential Elections in an On Harvard Time Special Edition! In Part 2 (of 3), anchor Derek Flanzraich interviews presidential candidate Matt Sundquist '09 and his running mate, R. Sarafa '09. Interested in their campaign? Check out http://www.SundquistSarafa.com Want more On Harvard Time, "The Most Prestigious Fake News in the World"? See our episodes and more at http://www.OnHarvardTime.com

    Watch on YouTube ↗

The summary and quote tags on this profile are produced with AI assistance from verified, first-person interview transcripts, then checked by our team to confirm the speaker's identity and the accuracy of every quote. See how we verify →